Introduction
In this report, an attempt has been made to predict whether a particular song will appear in the US top 200 billboard$^1$ based on the songs given it’s acoustic features. The Dataset under consideration is The Billboard 200 acoustic data which encompasses the entire chart from 1963-2019, along with the EchoNest acoustic features of as many songs as available. This dataset was curated for an article$^2$ on the data science analytics website Components. However that piece dealt with the album length alone, there could be plethora of other questions and analysis that can be answered/performed with this data. Since this dataset contain only songs that appeared on the billboard, further data (songs not on the billboard) was obtained using the Python Spotify API$^3$ (aptly called Spotipy).
The data obtained was highly imbalanced, with the acoustic features higly overlapping. The baseline accuracy is at ≈ 88%. A no. of classification algorithms were performed with stratified k-fold cross validation. Among all the models analysed, only the ones with accuracy above baseline are discussed here. These include Random Forest, XGBoost and Adaboost. The entire machine learning pipeline including data description, exploratory data analysis, cross-validation, model inspection and feature importance have been performed and the results have been discussed with measures of improvement for future studies.
Here is a description of the different acoustic features in the dataset:
| Features | Descriptions |
|---|---|
| key | The estimated overall key of the track. If no key was detected, the value is -1. |
| duration_ms | The duration of the track in milliseconds |
| mode | Mode indicates the modality (major or minor) of a track. |
| time_signature | An estimated overall time signature (beats in each bar) of a track. |
| acousticness | A confidence measure from 0.0 to 1.0 of whether the track is acoustic. |
| danceability | Describes how suitable a track is for dancing based on a combination of musical elements. A value of 0.0 is least danceable and 1.0 is most danceable. |
| energy | Is a measure from 0.0 to 1.0 and represents a perceptual measure of intensity and activity. |
| liveness | Detects the presence of an audience in the recording. |
| instrumentalness | Predicts whether a track contains no vocals. “Ooh” and “aah” sounds are treated as instrumental in this context. Rap or spoken word tracks are clearly “vocal”. |
| loudness | The overall loudness of a track in decibels (dB). |
| speechiness | Detects the presence of spoken words in a track. |
| valence | A measure from 0.0 to 1.0 describing the musical positiveness conveyed by a track. |
| tempo | The overall estimated tempo of a track in beats per minute (BPM). |
Exploratory Data Analysis
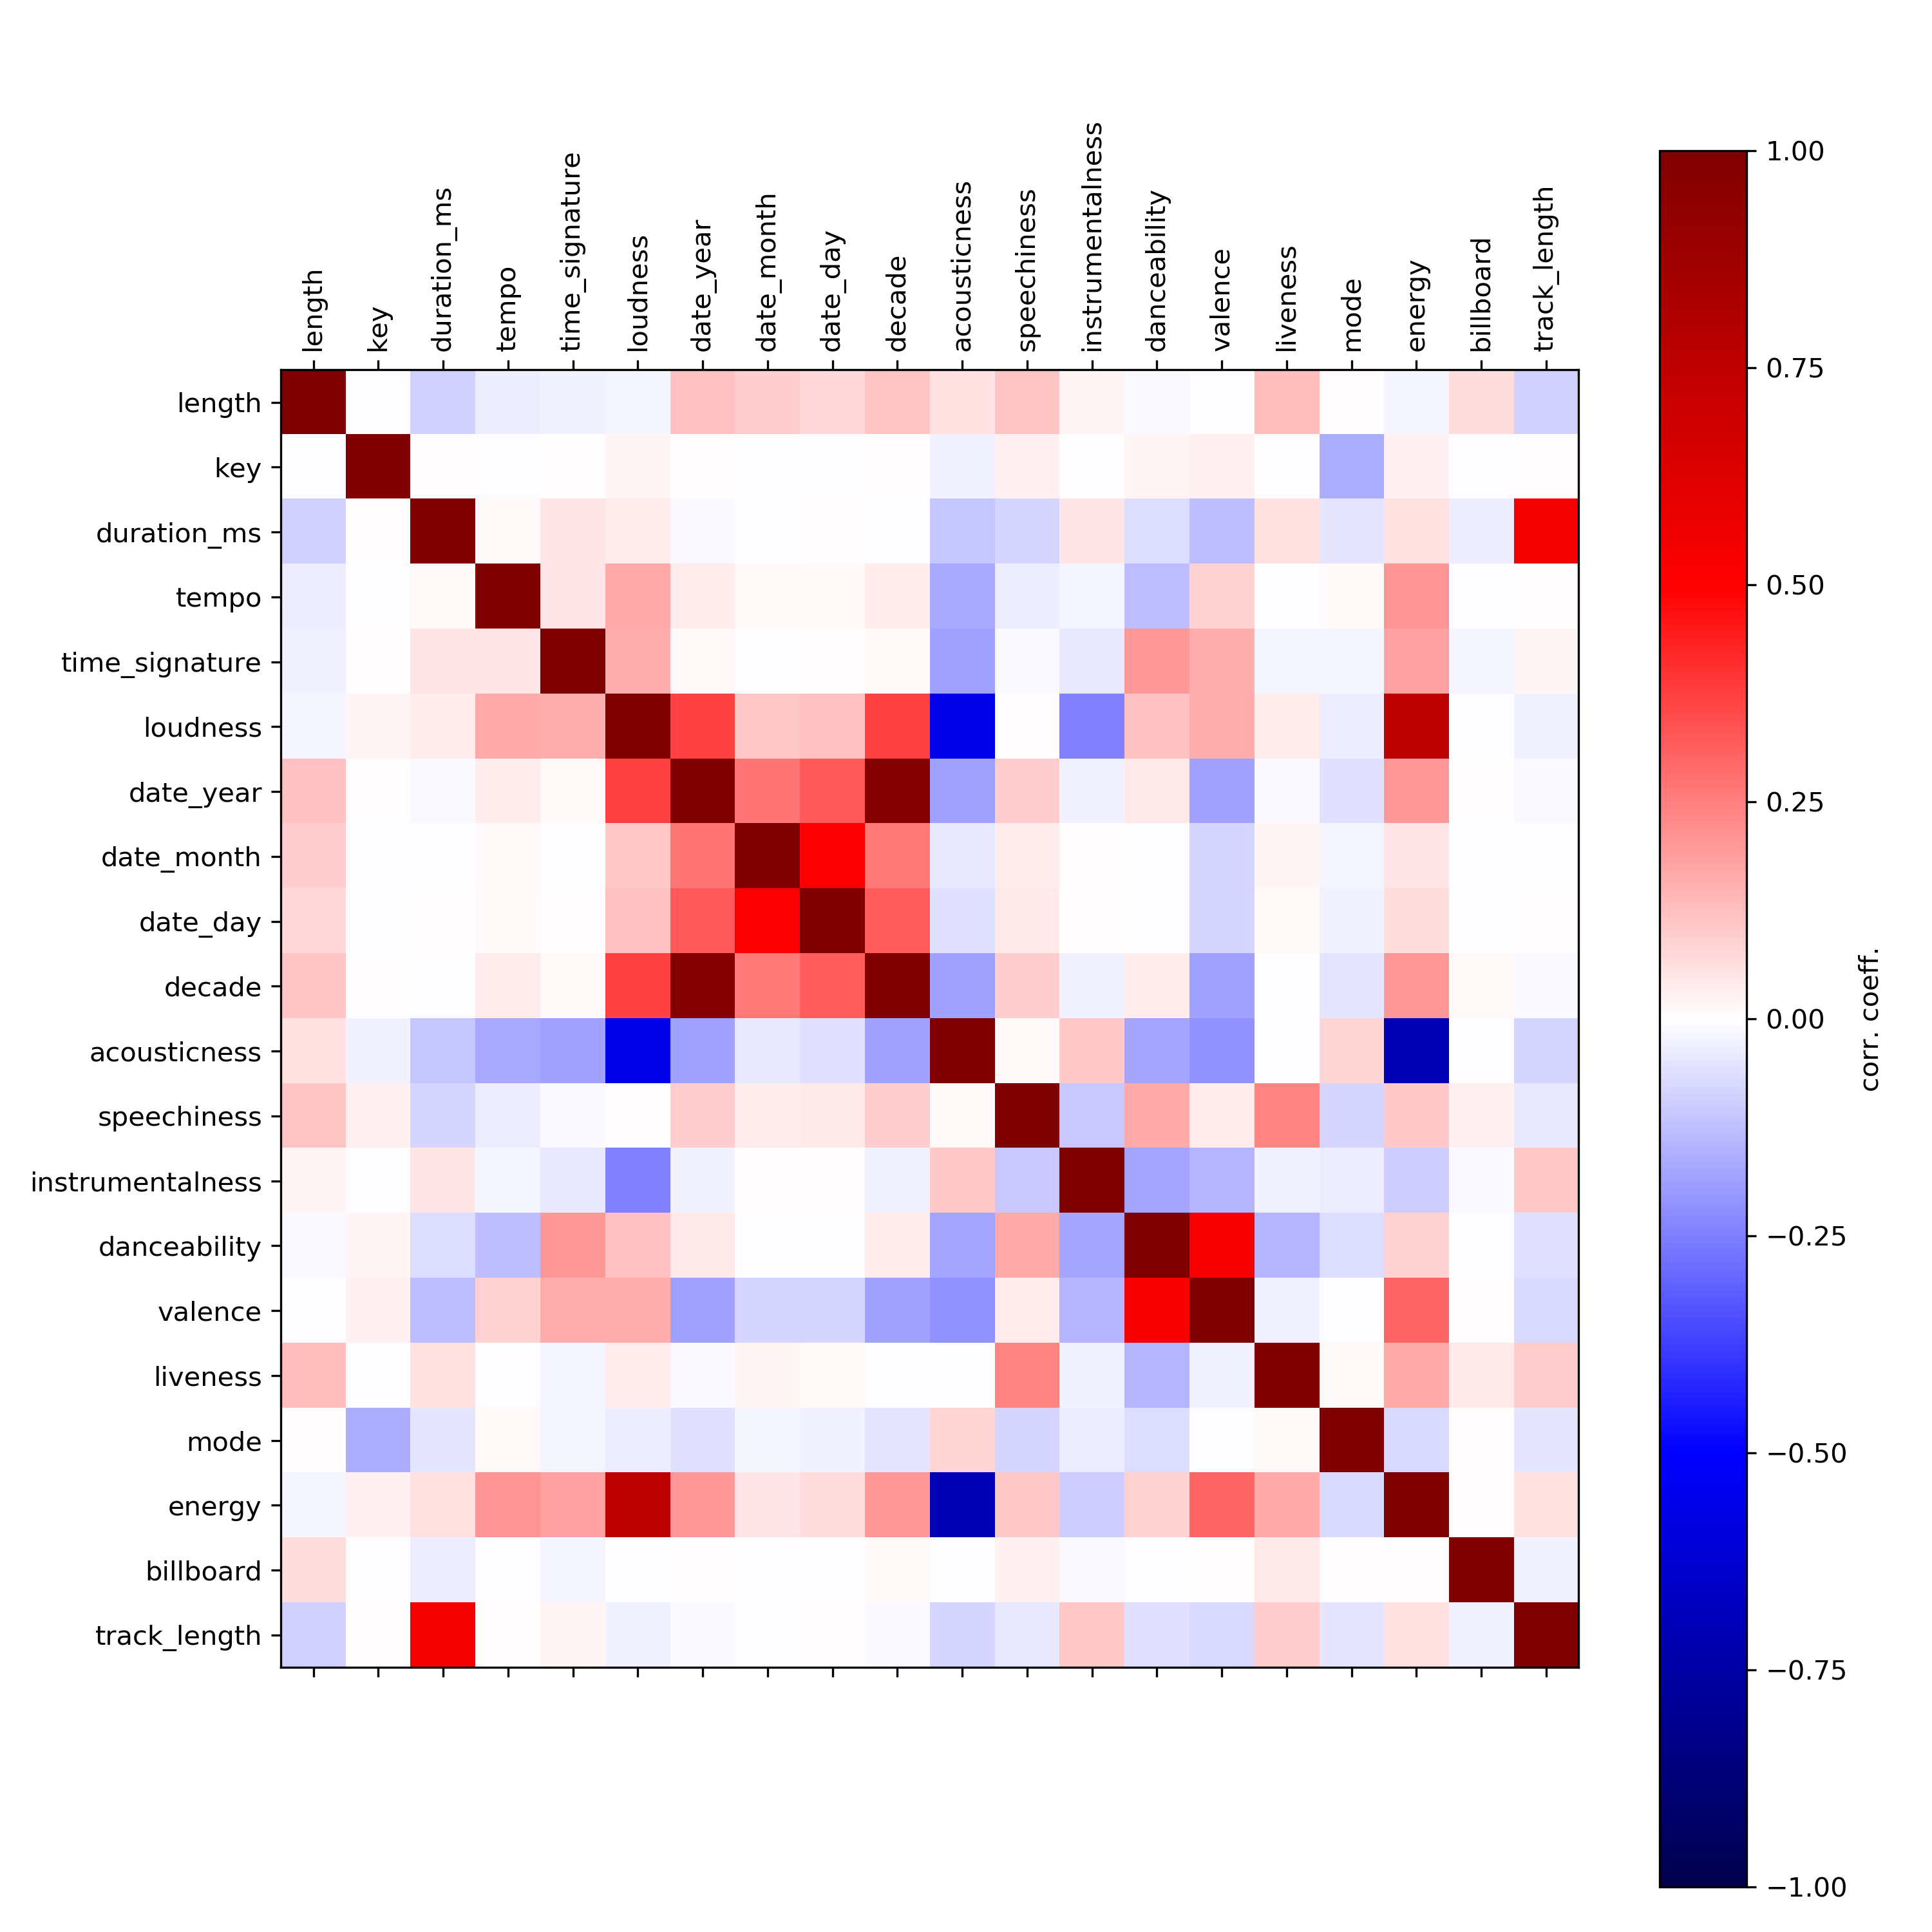
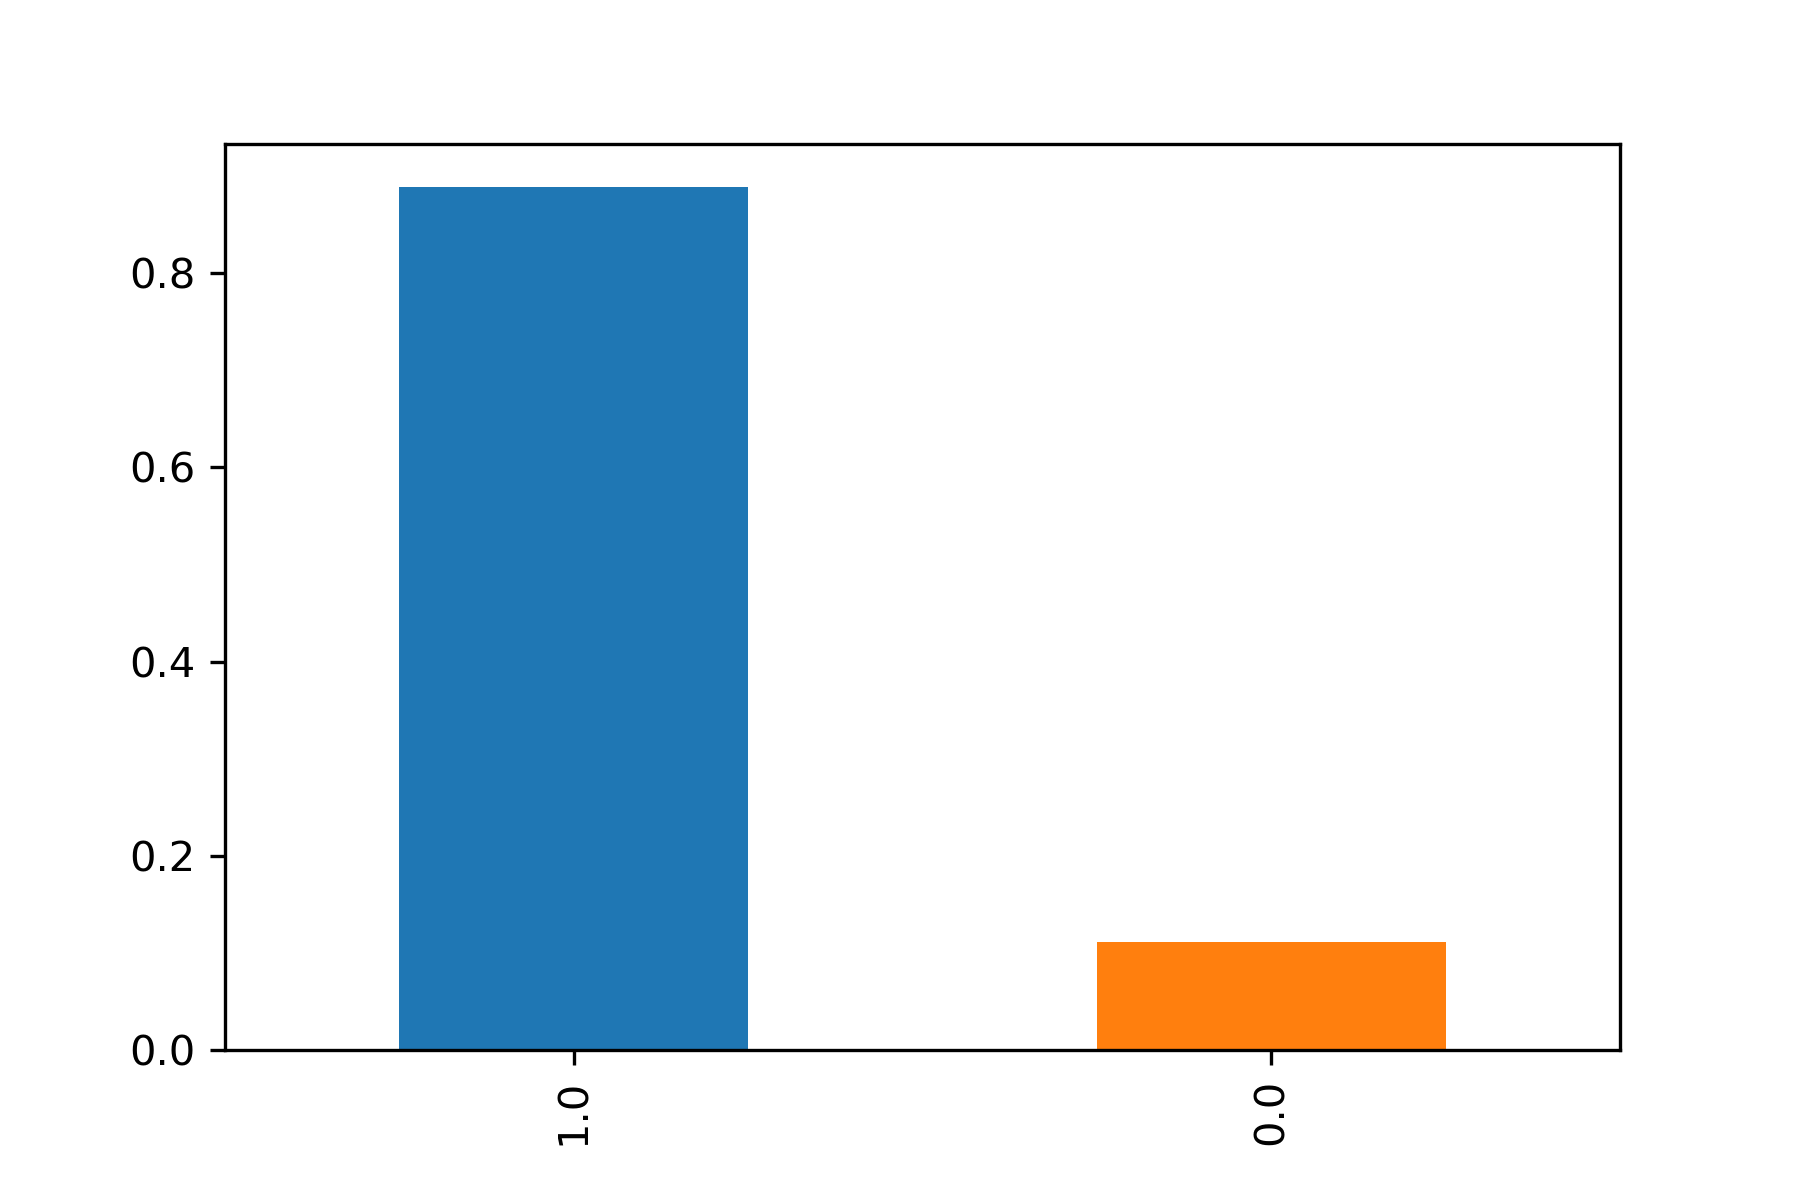
The features are not very correlated from each other as observed in figure below while the dataset is highly imbalanced (≈88%). However the data is distributed to match the overall dataset balance when observed on a yearly basis.
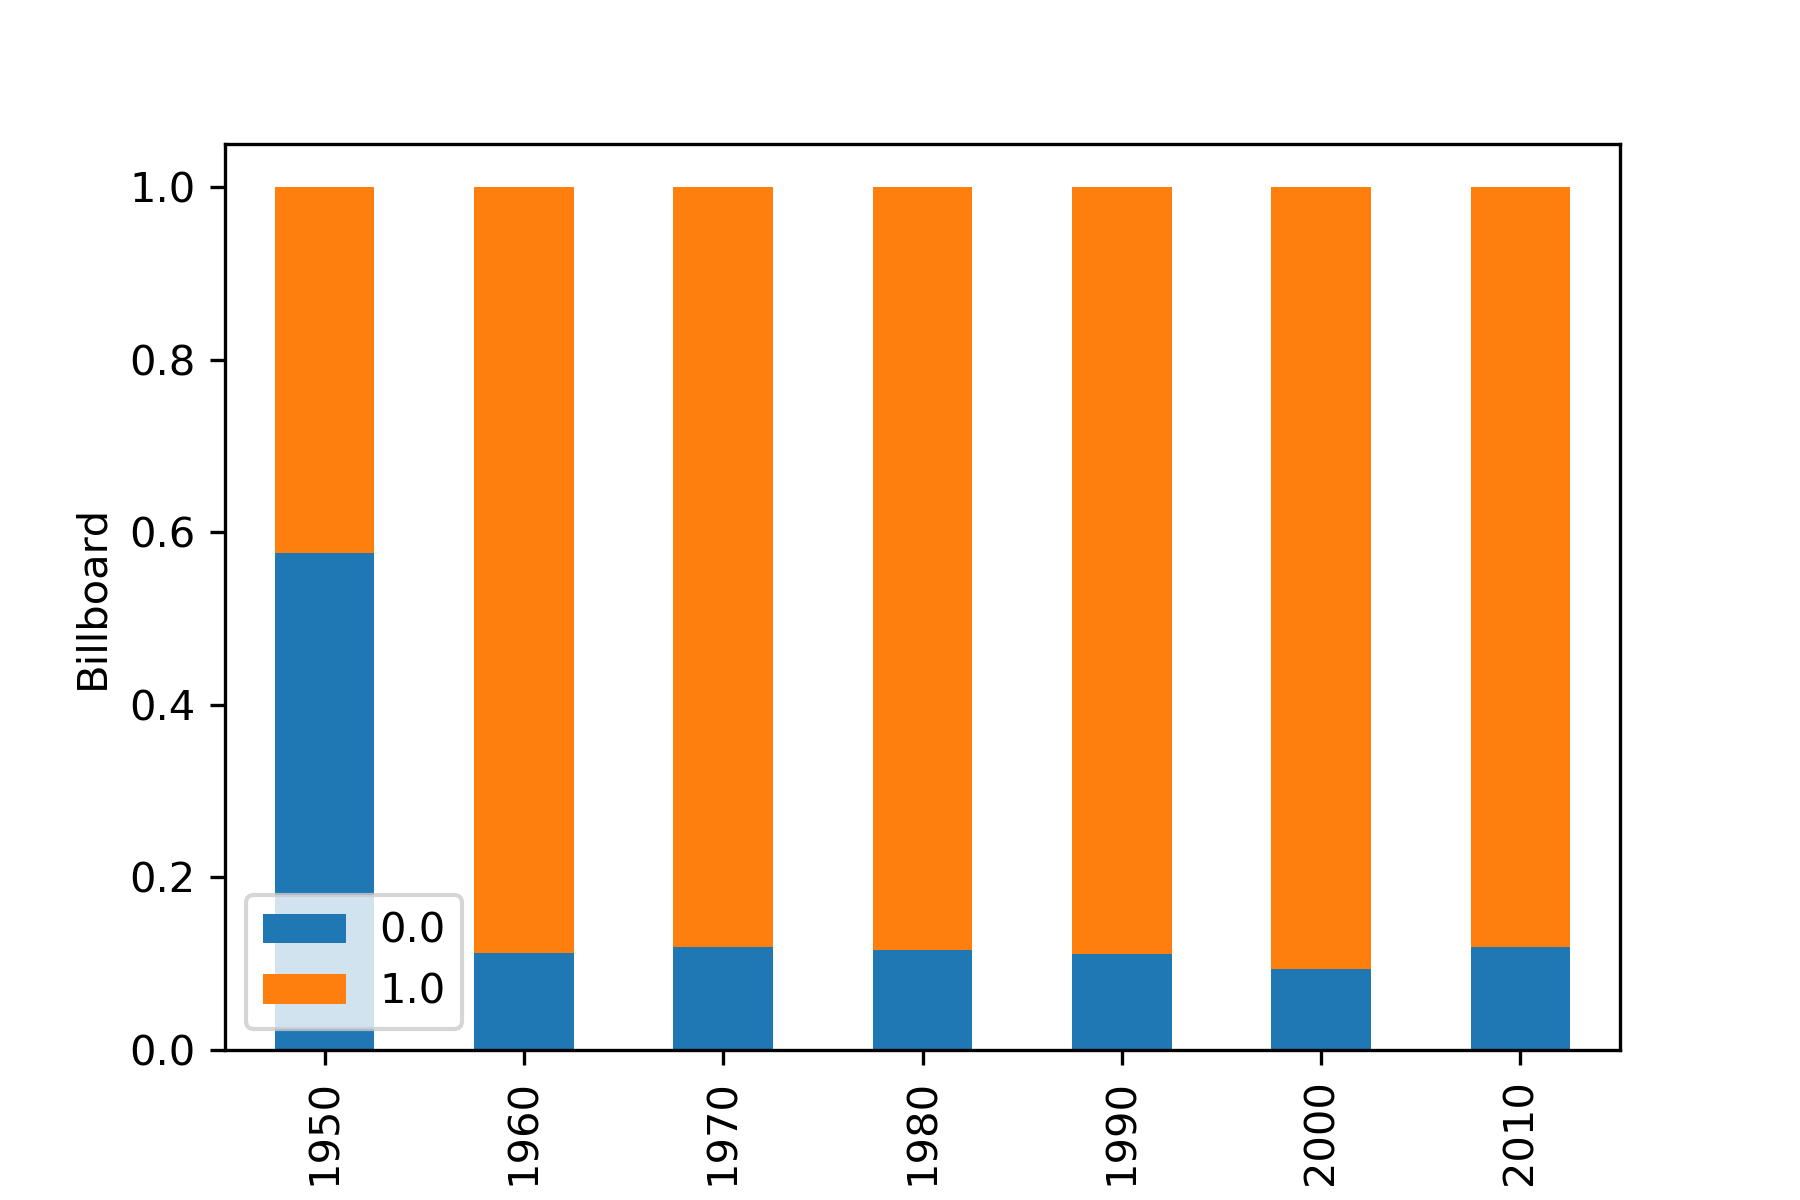
To study the evolution and behaviour,we also checked how the acoustic features evolve with time and with respect to songs on or not on the billboard
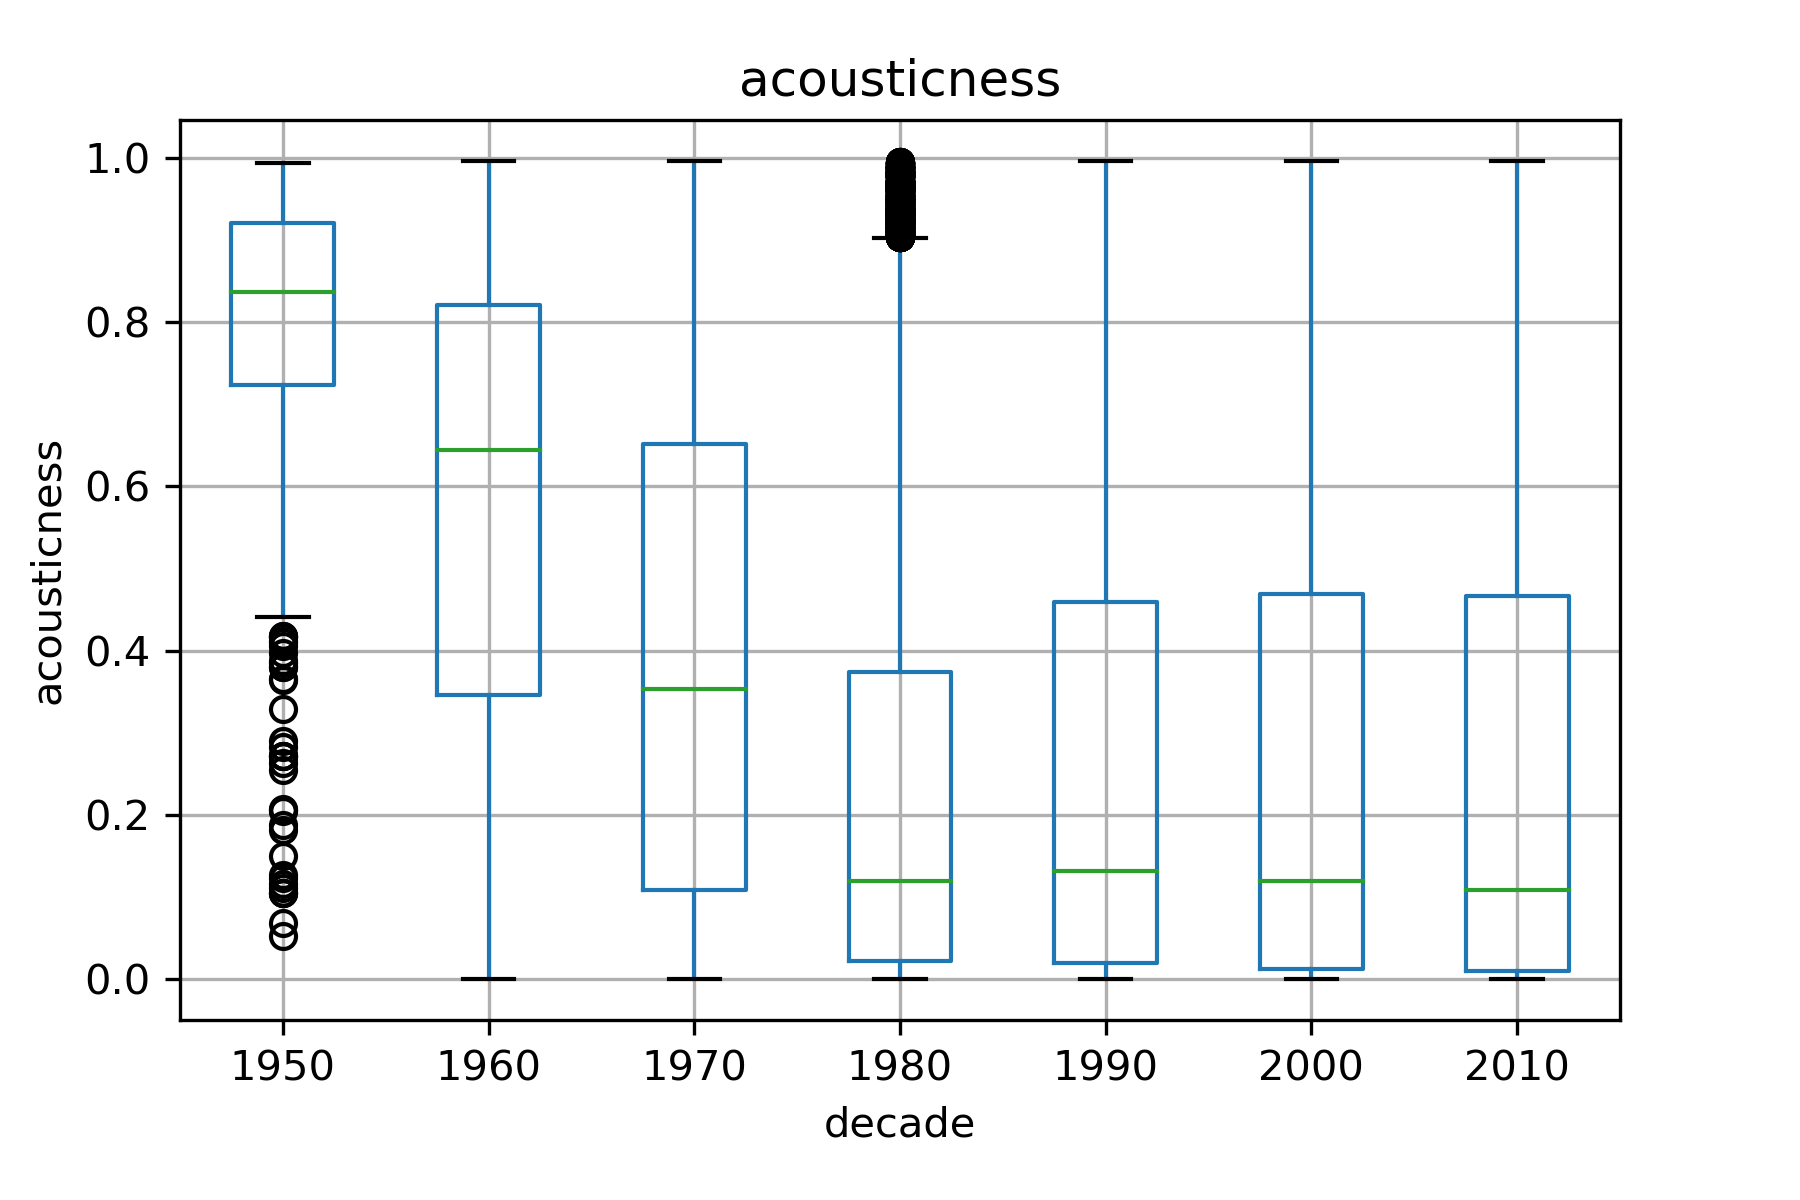
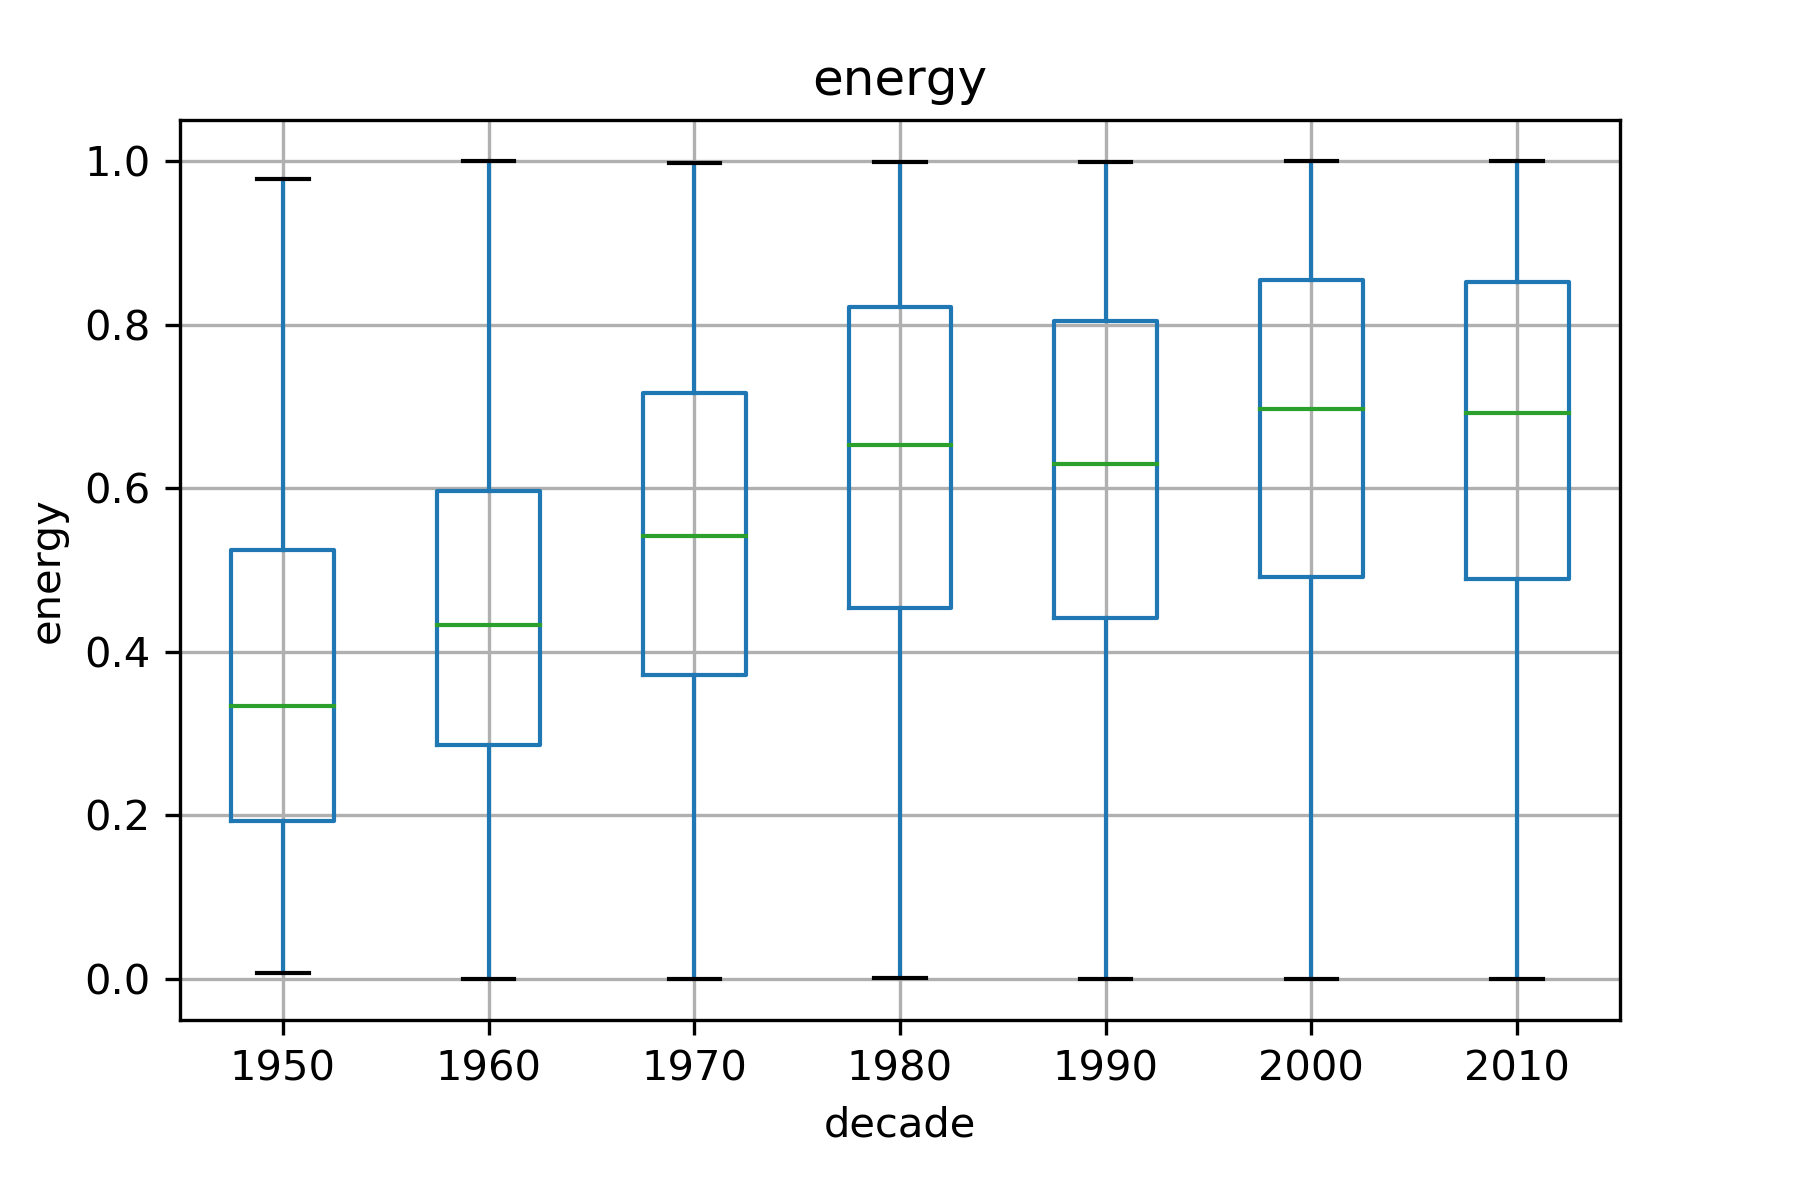
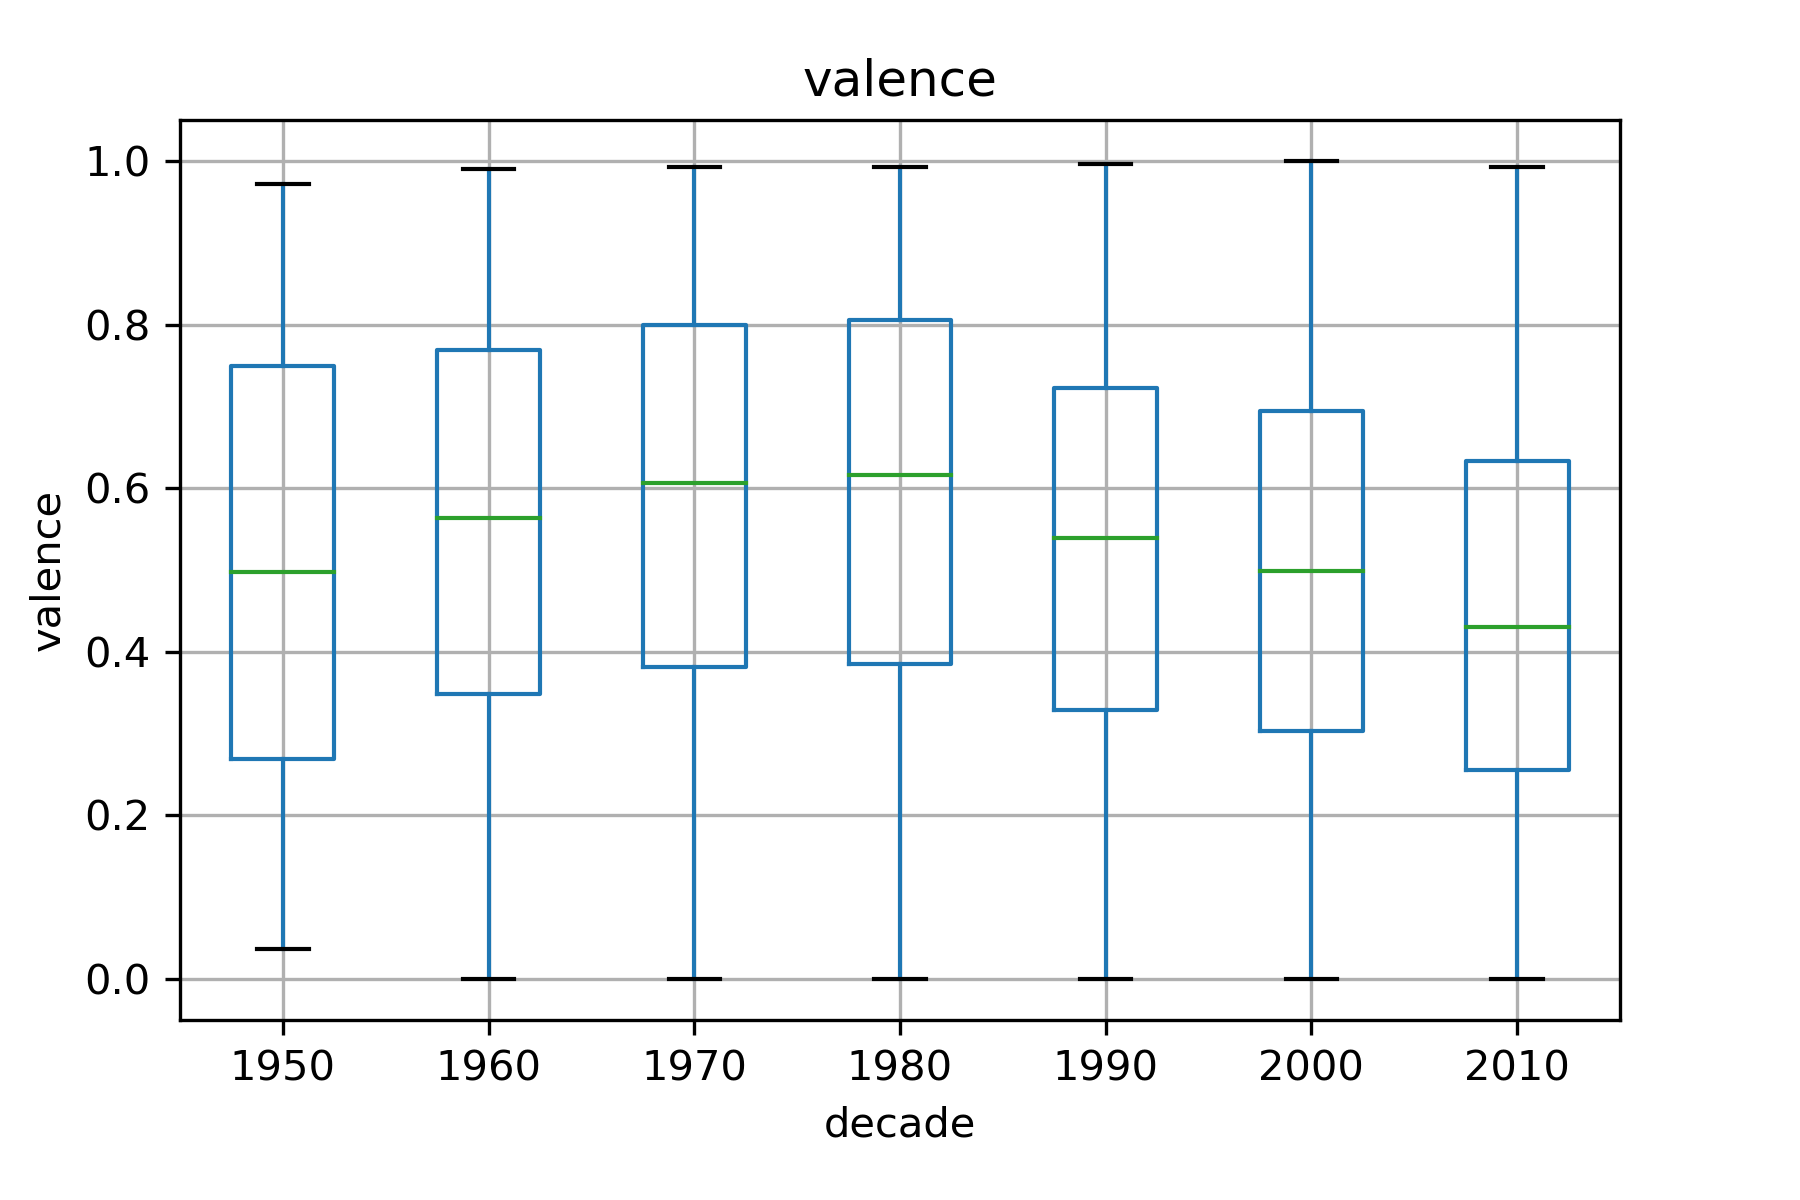
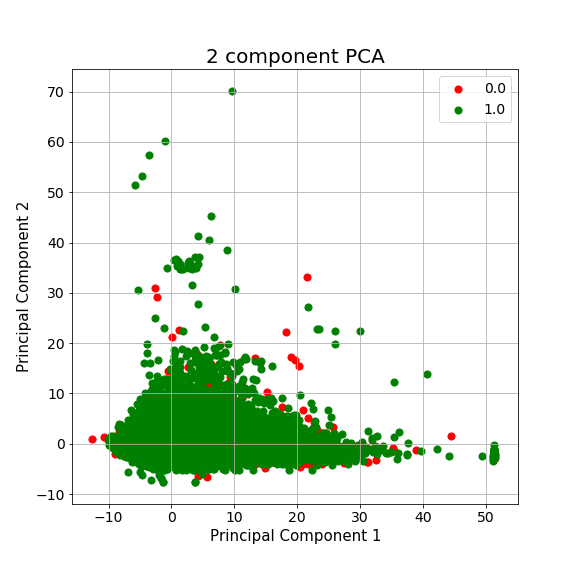
It was observed that the range of values for most features do not vary with time, except acousticness, valence and energy. With the advent of electronics, it makes sense that songs have been departing from pure acoustic nature. Likewise, rock, metal, and more recently hiphop and electronic dance music have increased the energy levels of songs. Suprisingly,the valence (an indicator of the positiveness of a song) has slightly decreased over the year. Due the low variablity of acoustic features and imbalance of the dataset, before we move to model evaluation, we expect the classifier to have a tough time (as can be guessed from the plot of the 1st two principal component where the points are highly overlapping)
Machine Learning Pipelie
Preprocessing
The following are the broad categories of pre-processing applied to the datasets:
- The date values (date released and dates on the chart) were each parsed to python datetime object and split to 3 columns - day,month, year. No scaling is done as yet onthese features.
- The song_id and album_id are kept in the spotify unique id format. To be scaled upon further discussion.
- Acousticness, danceability, energy, instrumentalness, liveness, mode, speechiness, valence features are already scaled between[0, 1]. No further pre-processing was required.
- Rank, track duration, key, tempo, time signature, loudness, album duration, albumlength, were all scaled using the StandardScaler.
- The billboard label is added as 1 (if present) and 0 otherwise.
Note for the final analysis, I have ignored the month and day as it is arbitrary and does not play any role when it comes to billboard consideration, and thus work only with the year. Since artist name, album name and song name was only used to curate songs,they are dropped from the final dataset before pre-processing.
Cross Validation Pipeline
In this study, we are trying to predict whether future songs would appear on the billboard,hence time of the song is not a factor in the requirements. We could have dropped the date feature but would anyway expect it have least importance.
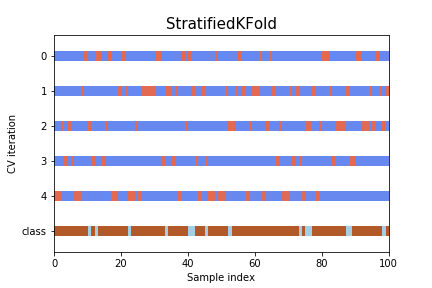
However the data is highly imbalanced. Therefore the choice of cross-validation pipelinewas chosen to be a stratified KFold Cross Validation, where the global distribution of classesis maintained in the K fold train, CV splits. The result of the splits are as follows
Model Selection
Due to the large number of datapoints, certain popular techniques such as K-nearest Neigh-bours, and Support Vector Machine Classification failed to converge after 12 hours. Othermethods such as Linear and Quadratic discriminant analysis failed to improve model performance over the baseline. For each of the model, we performed an exhaustive search for the parameter value in each estimator. Details of which is also described under each method.
Evaluation Metric: For all the models, we used the accuracy score since it is a binaryclassification problem.
Random Forest Classification
Test Baseline: 0.8807
Test Score: 0.8865
Optimal Parameters:
n_estimators: 100,
criterion: gini,
max_depth: 10,
min_samples_split: 3
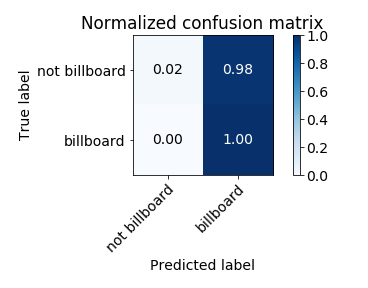
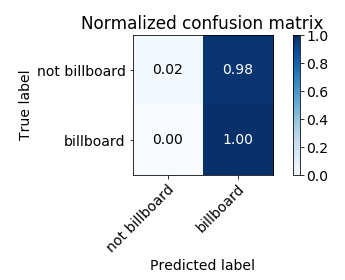
The normalised confusion matrix is as follows:
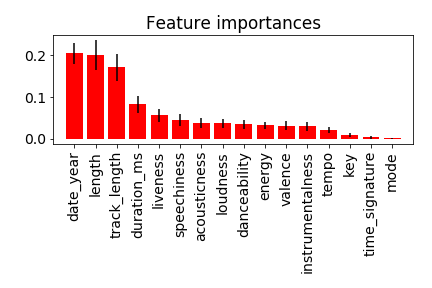
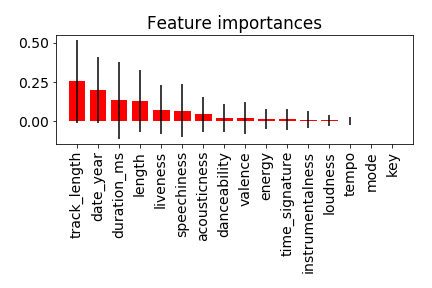
The feature importance under random forest are:
XGBoost Classification
Test Baseline: 0.8807
Test Score: 0.8865
Optimal Parameters:
max_depth: 15,
gamma: 0.4,
min_child_weight: 1,
learning_rate: 0.3
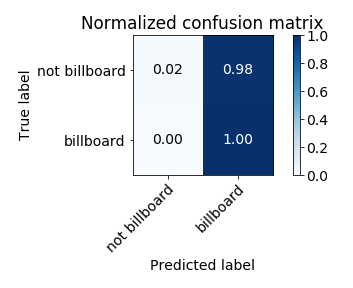
The normalised confusion matrix is as follows:
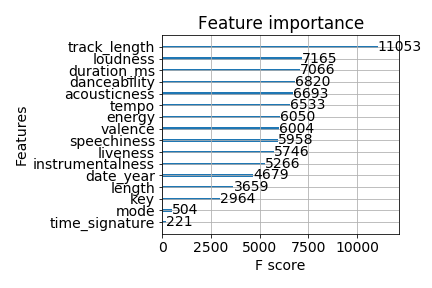
The feature importance by based on F score (as per SelectFromModel) under XGBoost is as follows:
Adaboost Classification
Test Baseline: 0.8807
Test Score: 0.8865
Optimal Parameters:
algorithm: SAMME.R,
gamma: 0.4,
n_estimators: 100,
learning_rate: 0.1
The normalised confusion matrix is as follows:
The feature importance under AdaBoost is shown as follows:
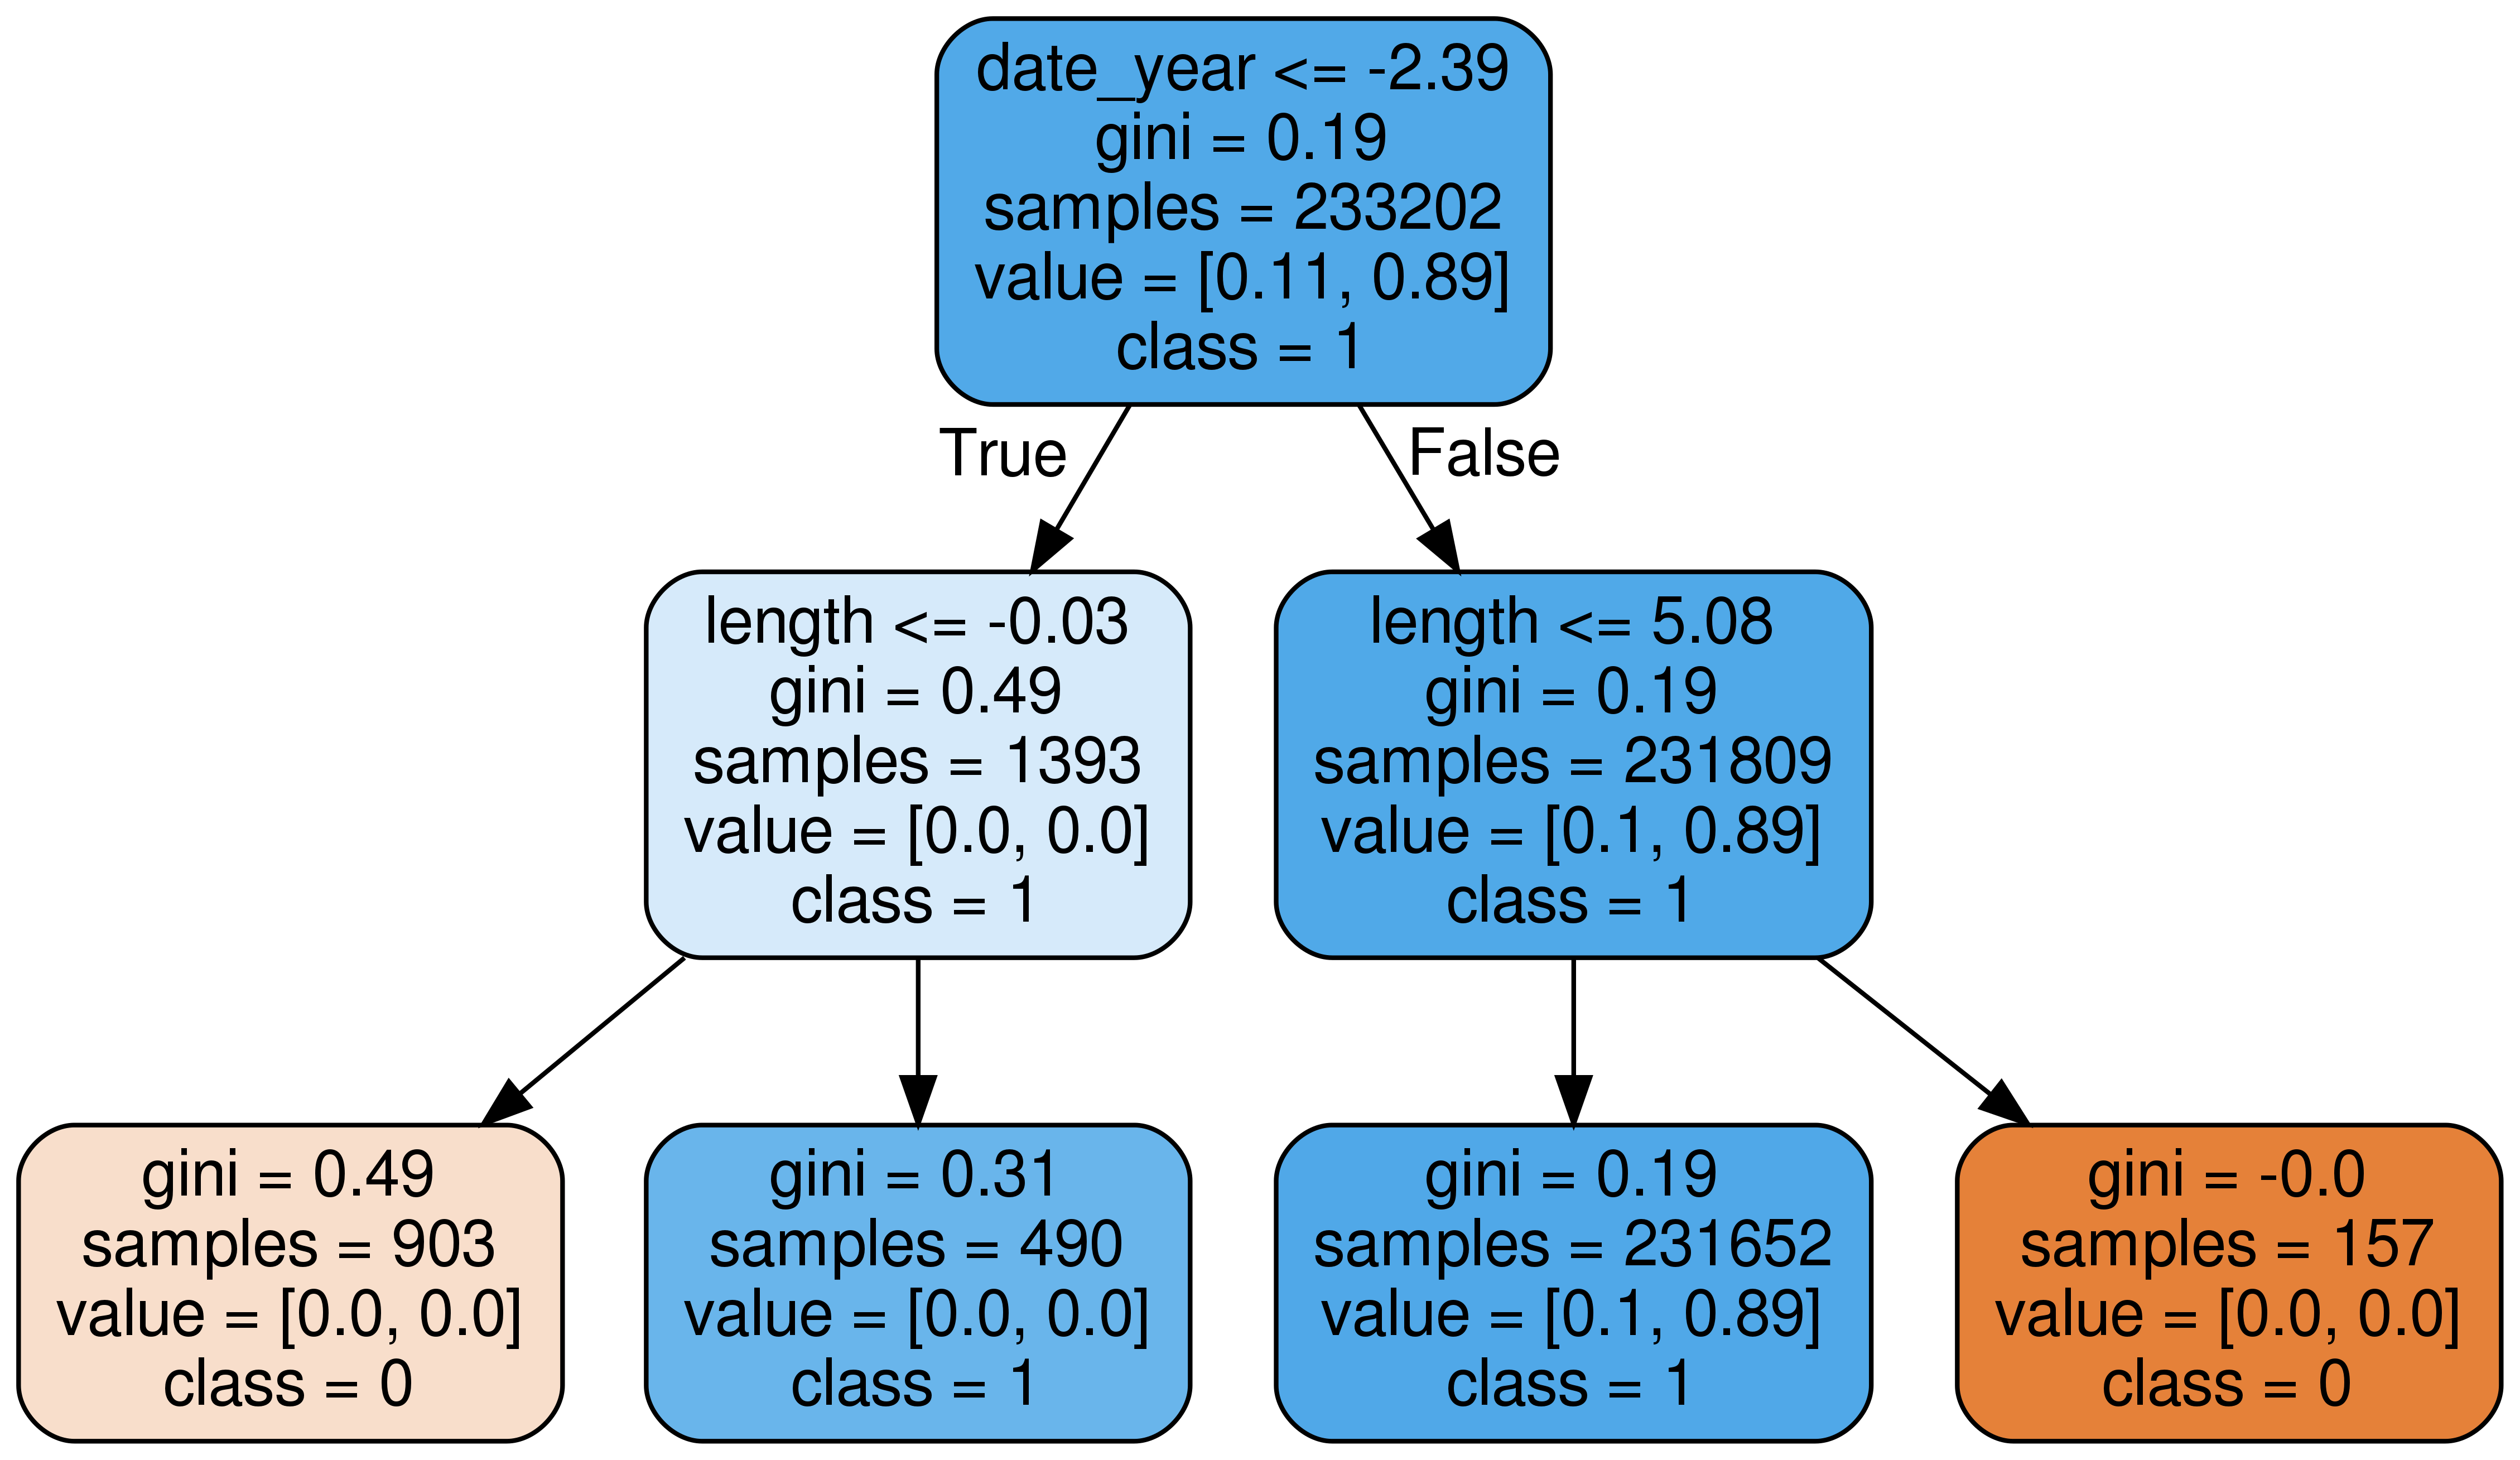
The tree estimator with least error of the adaboost classifier is shown as follows:
Outlook
The results of this project was not satisfactory. Except track length no other feature showed any importance that makes it stand out. The good news is that we can suggest solid steps tofurther improvement. The most important of them would be:
- The dataset was highly imbalanced. Having a much more evenly divided set among the classes would improve the results.
- The acoustic features of songs in both the classes overlap highly. To a large extent this was a fault of the method of data collection for songs that are not in the billboard. Theywere based on songs by artist that are similar to the artist in the billboard.
- Advanced deep-learning methods could improve the result
- Due to lack of time, certain methods such as support vector machine classification or K-nearest neighbours couldn’t be implemented. Among the models tested on, a widergrid search might have also led to some improvements
References